 forexexp
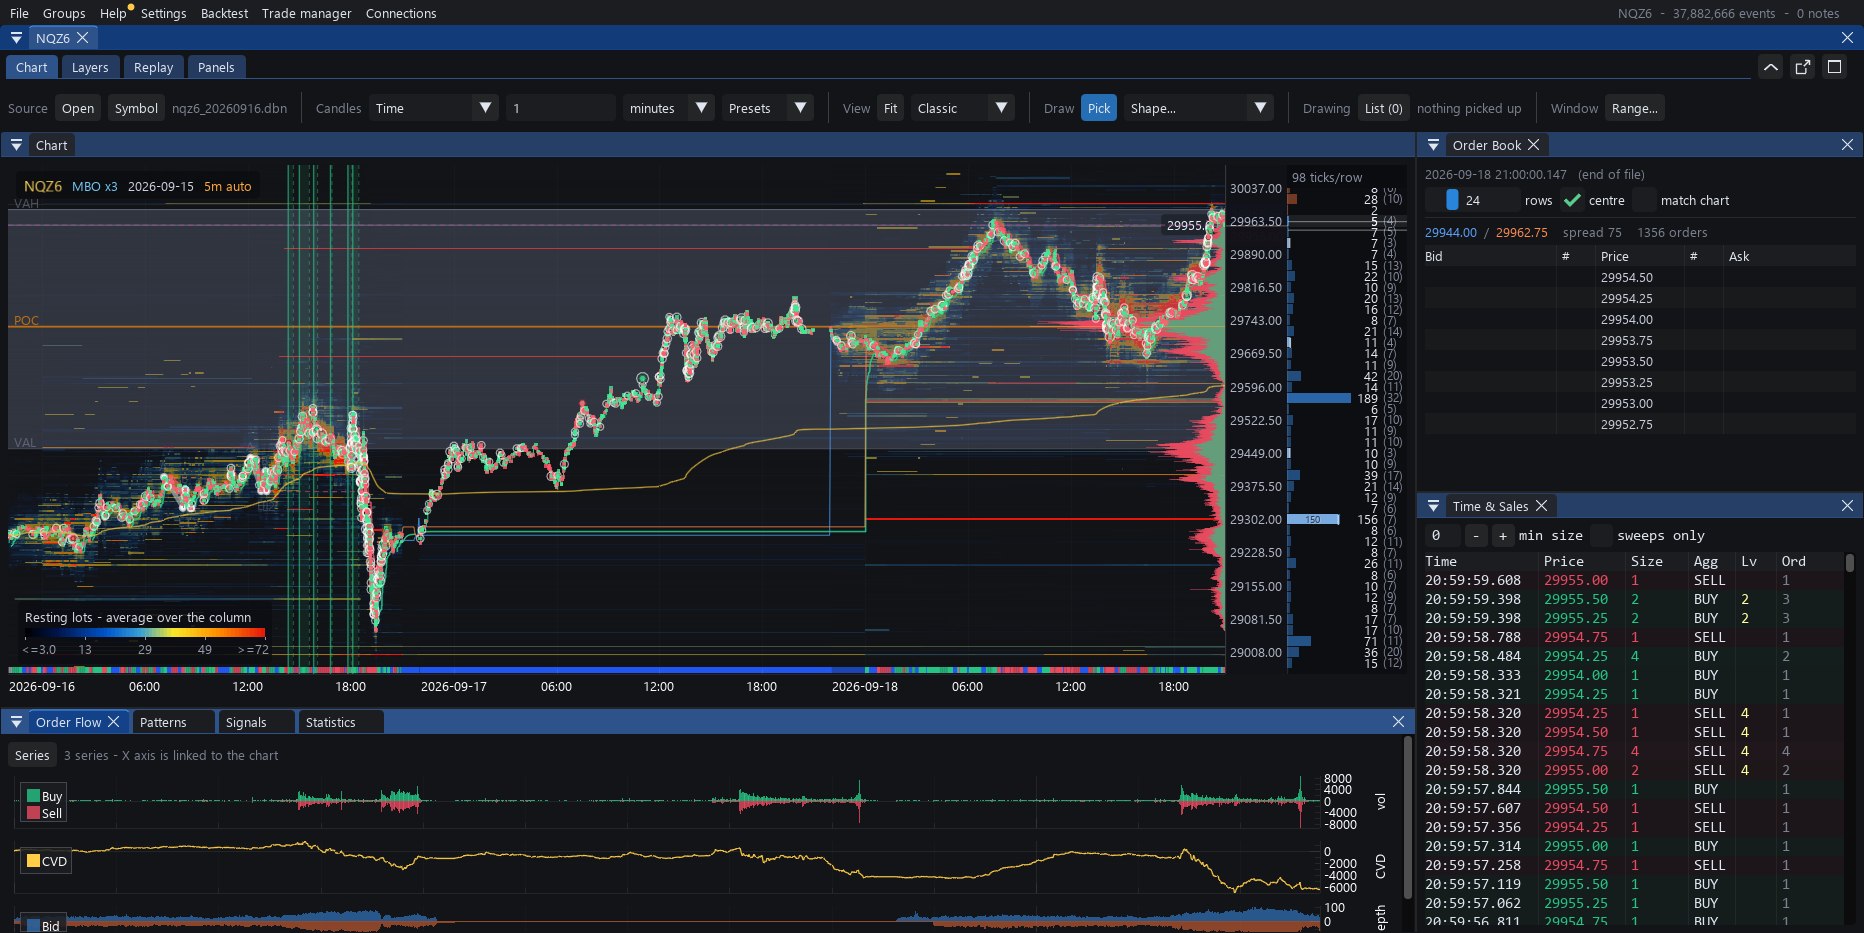
Liquidity heatmap
Explore displayed liquidity over time using supported order-book data. The view represents the events and depth available in the dataset; it is not a complete view of hidden liquidity or all market activity.
MBO Analyzer for Windows
MBO Analyzer is Windows software for market-data analysis and strategy research. Explore supported tick and market-by-order datasets, define rules in JSON, inspect simulated backtest results and practise with simulated trading inside the software. Available views and analyses depend on the data format, software version and licensed features.
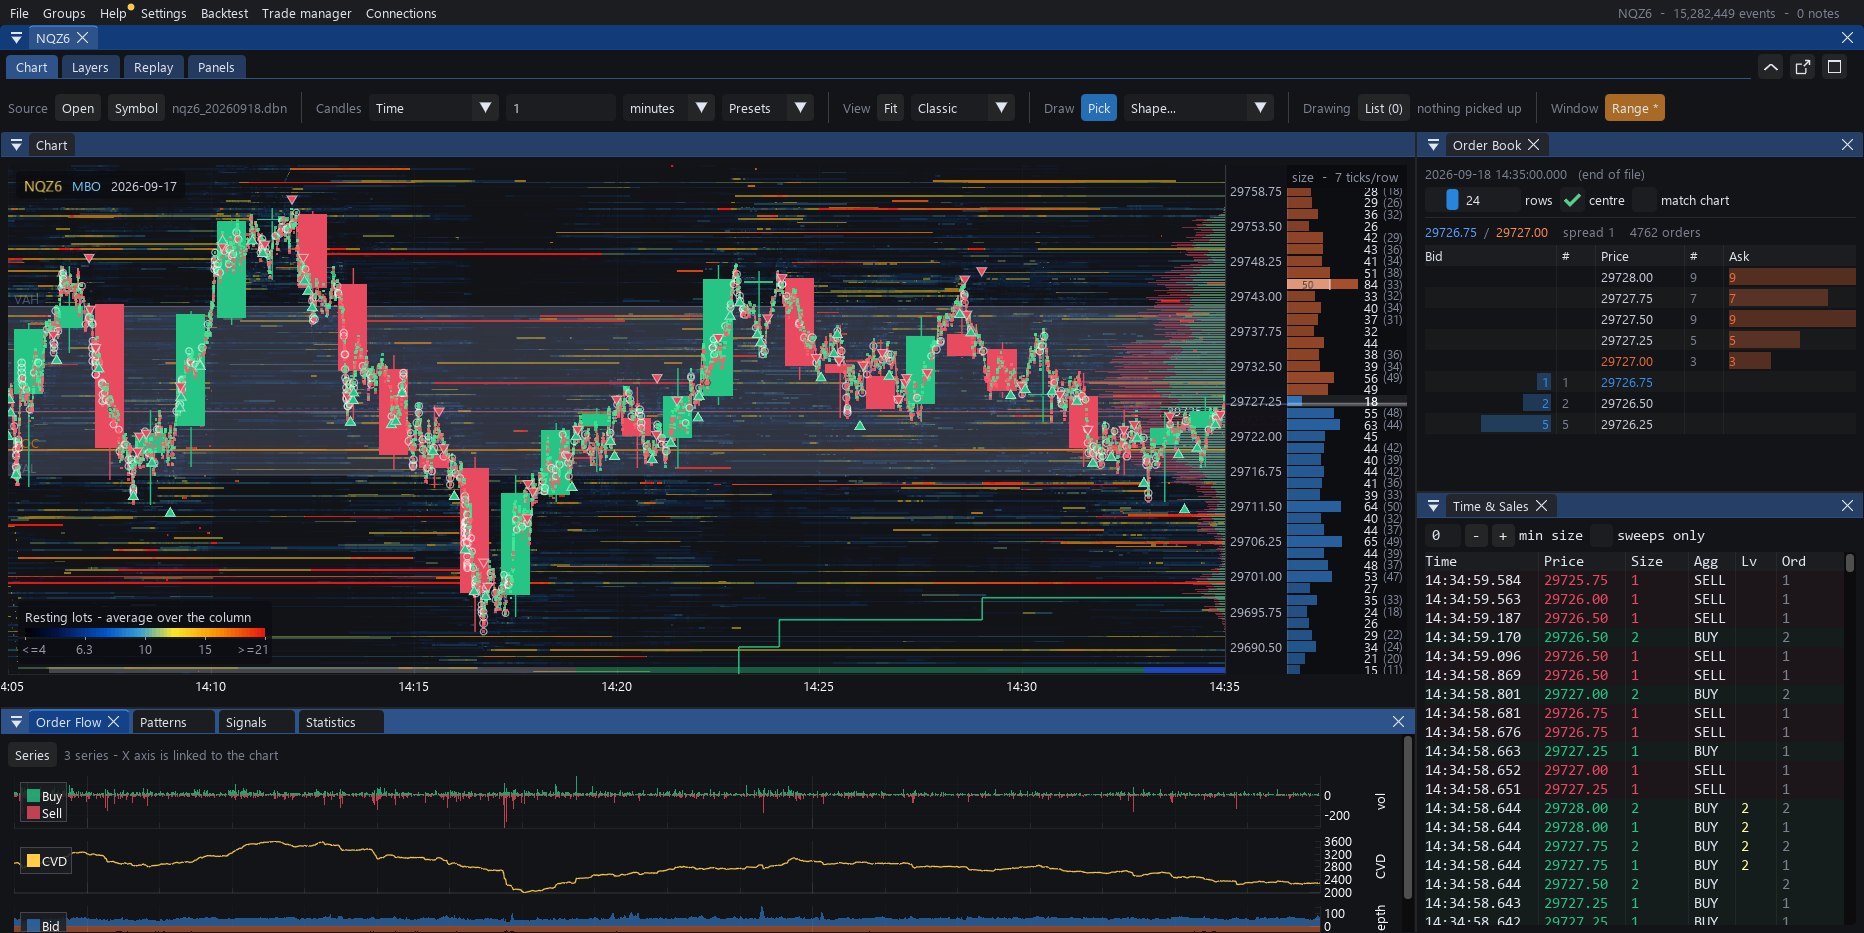
Simulated trading takes place entirely inside the software: orders are modelled by the software and are never sent to a broker, an exchange or a broker's demo account. MBO Analyzer does not place real-money orders, copy trades or deliver trading signals.
Check the supported-format documentation and your software plan for feature availability. Different input formats expose different information.
Explore displayed liquidity over time using supported order-book data. The view represents the events and depth available in the dataset; it is not a complete view of hidden liquidity or all market activity.
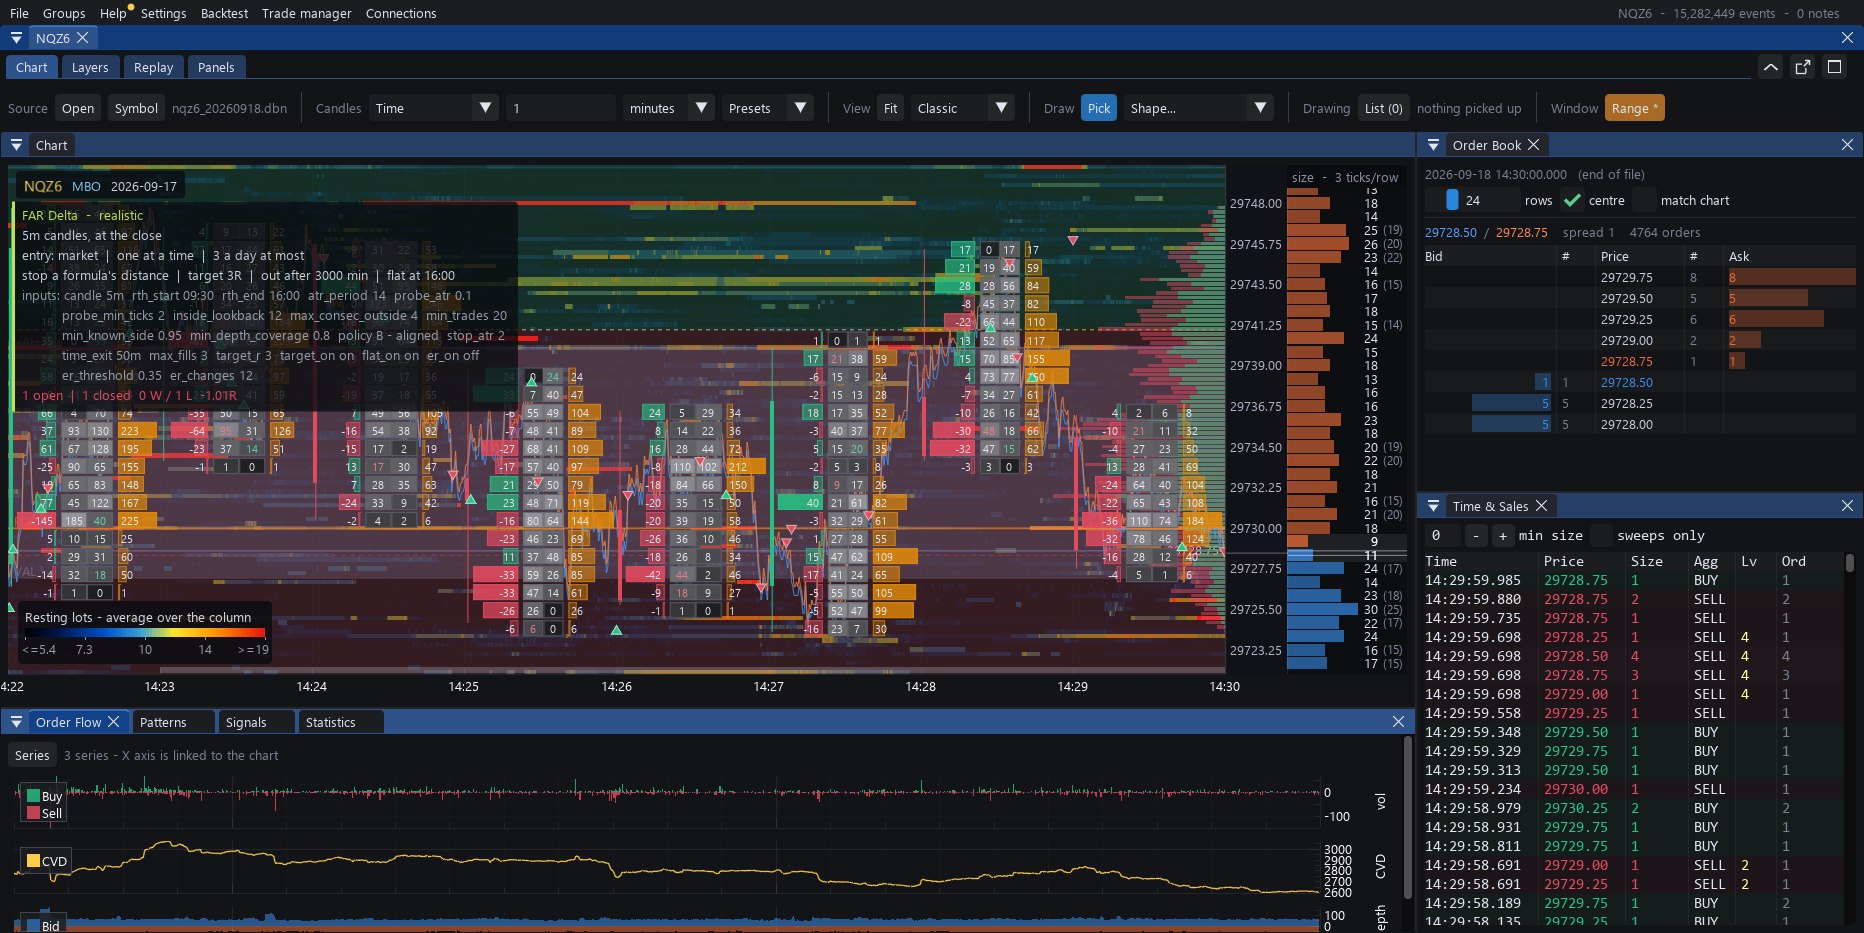
Review recorded trade volume and available derived views, such as delta and volume profiles. Interpret each calculation using its documented data inputs and settings.
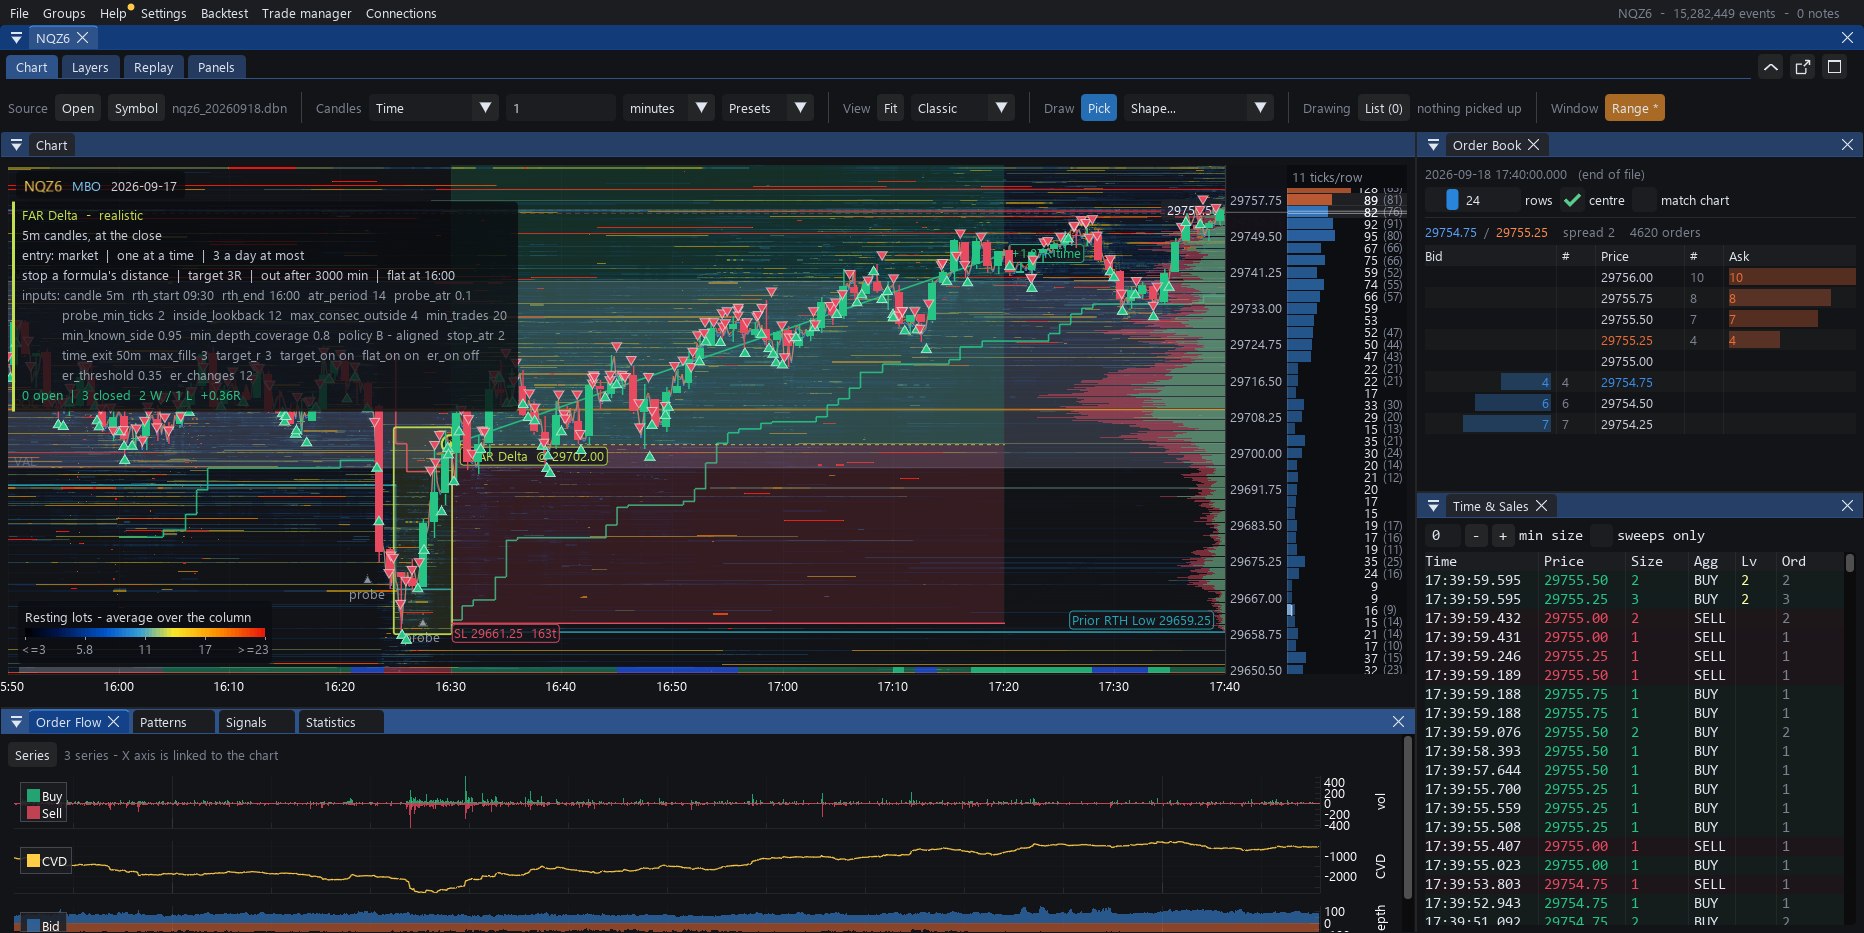
Describe research rules using the supported JSON specification. You can write definitions yourself or use an AI assistant with the documentation. Review generated files, check supported features and validate their behaviour before relying on any result.
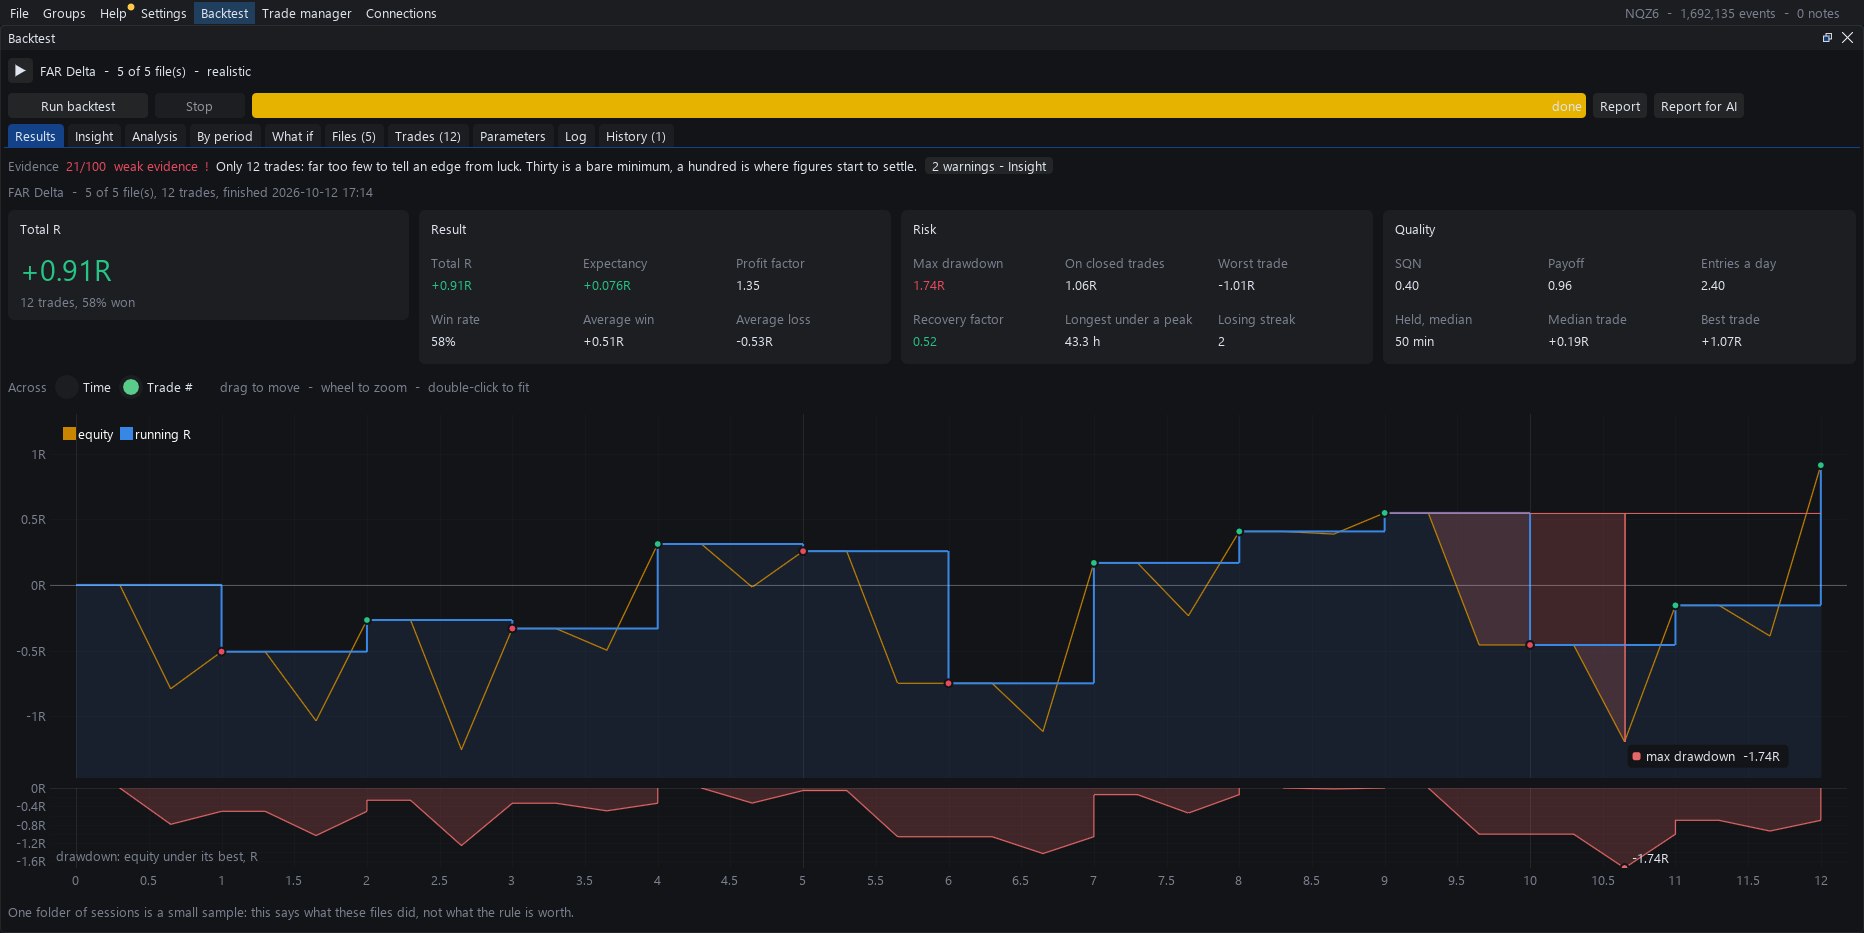
Evaluate supported strategy definitions against historical data using the fill and cost settings available in your build. Review the assumptions and run configuration alongside the results. Simulated fills and performance may differ substantially from conditions that could be achieved in a real market.
For compatible MBO inputs, reconstruct the book state represented by the available additions, amendments, cancellations and reported trade events. Feed coverage, missing events and data quality can limit the reconstructed view. Pattern labels do not establish hidden order size or a participant's intent.
Inspect available depth levels and a time-ordered view of recorded trades. Where classifications are calculated or inferred, interpret them using the documented method rather than treating them as facts supplied by every feed.
Review supported order-flow indicators and event labels as analytical models. Their definitions, timing assumptions and limitations matter. Any subsequent-outcome analysis should be read separately from information available at the event time.
Practise on the chart with an order ticket and a position manager in simulated trading, on recorded or real-time data. Orders, fills and positions are modelled by the software and never sent to a broker or an exchange; simulated stops and limits do not protect a real account.
Import compatible tick exports, including supported MetaTrader 5 formats, for simulated Bid/Ask strategy research. Check timestamps, symbol settings, contract specifications and transaction-cost assumptions for each dataset. Bid/Ask tick exports do not provide MBO order-level information.
On plans that include it, connect a supported real-time data feed to view market data for analysis and run strategies in simulated trading. The connection only receives data and never submits orders. Provider access, market-data permissions and any provider charges are separate from the software licence.
On plans that include it, save supported market-data events for later analysis. Recorded history depends on settings, connectivity, feed coverage and available storage; missing events cannot be assumed to be recoverable.
Explore the time ranges supported by your data and system resources. Loading time, chart responsiveness and memory use vary with event count, enabled calculations and hardware.
Get a notification, including an optional Telegram message with a chart image, when conditions you defined are met in the software. The software sends it from your computer to your own Telegram chat. Alerts report your own rules; they are not trading signals or recommendations from us, and they never place orders.
Review backtest reports together with the dataset, strategy configuration and modelling assumptions used for the run. You may use reports to examine results with an AI assistant, but generated interpretations can be wrong and do not establish future performance.
Large datasets and extended runs require suitable memory and storage. Save research files and keep copies of important data and results. Software or hardware interruptions can affect a run; uninterrupted operation is not guaranteed.
Historical simulations are affected by data quality, modelling choices, costs and the selection of rules and parameters. A strong historical result can reflect overfitting and may not continue. No profit, accuracy, loss limit or match to real execution is guaranteed. Read the research and risk notice.
Requirements vary by dataset and enabled features. Larger order-book datasets can need substantially more resources than smaller tick-data files.
| Minimum | Recommended | |
|---|---|---|
| Operating system | Windows 10, 64-bit | Windows 11, 64-bit |
| Graphics | DirectX 11-compatible GPU | Dedicated GPU |
| Memory | 8 GB for smaller datasets | 32 GB or more for larger order-book datasets; actual needs vary |
| Storage | SSD with 10 GB free | SSD with 100 GB or more free when recording market data |
| Network | Internet access for account and licence functions | A stable connection for real-time market data |
| Additional runtime | .NET 8 Desktop Runtime (for real-time market data) | — |
Evaluate the research features included in your trial licence on one computer. No payment card is required.